Station Management &Customer Info Portal.
LIMA integrates schedule data, bespoke analytics and station infrastructure into a single workspace — producing and managing customer-facing outputs, from platform maps to print-ready posters, without the manual rework.
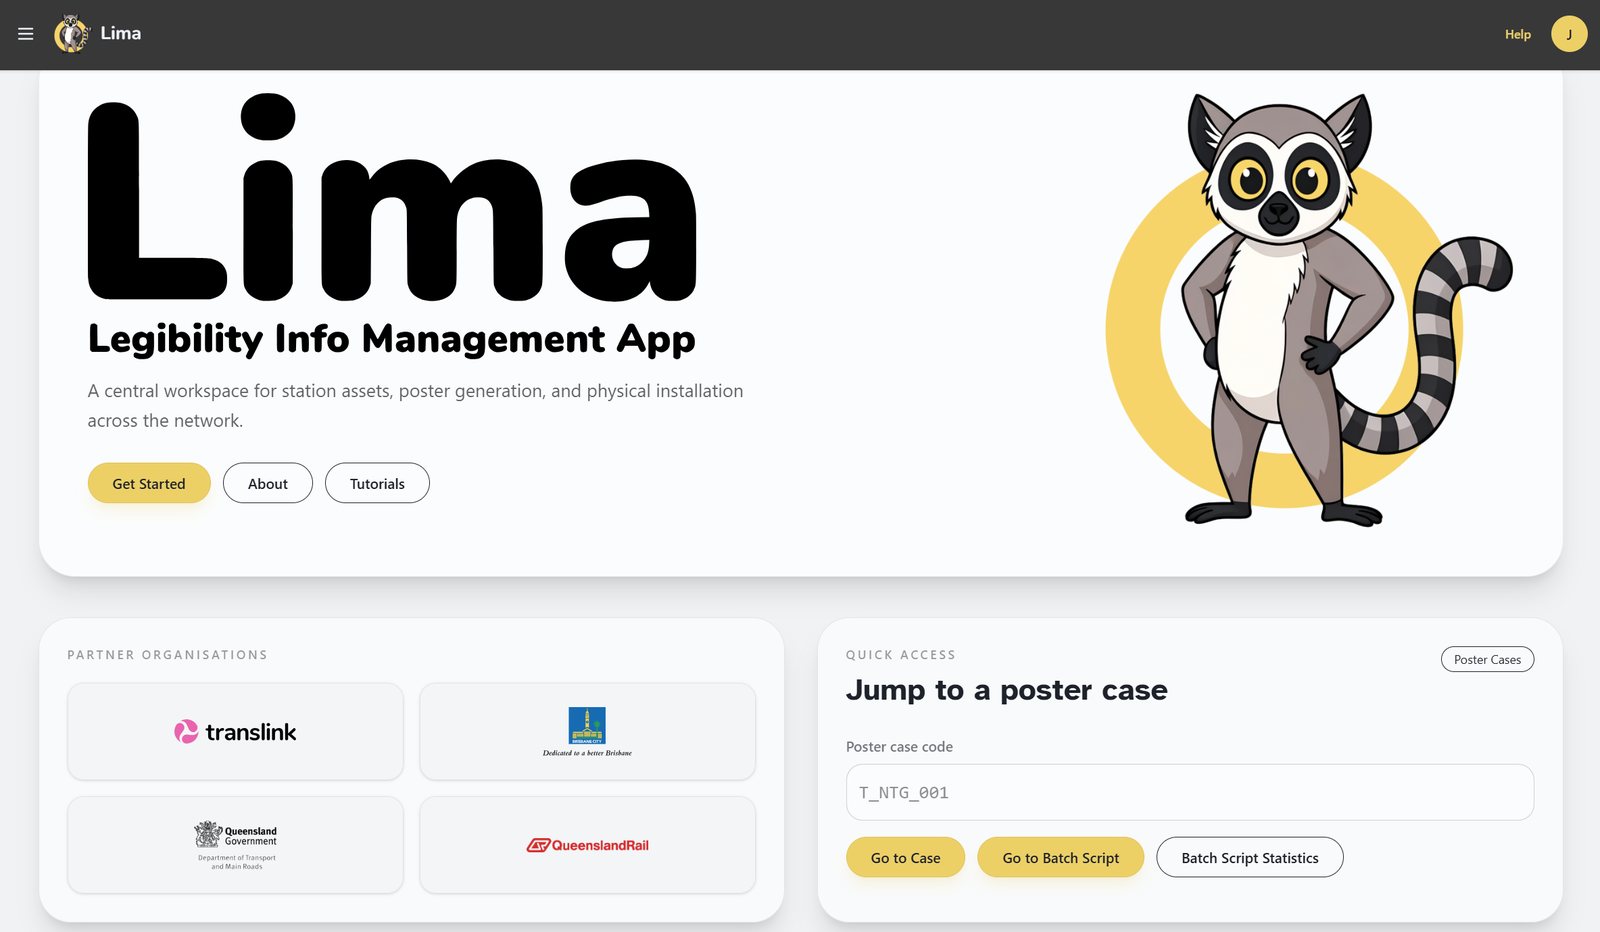
Data Stream
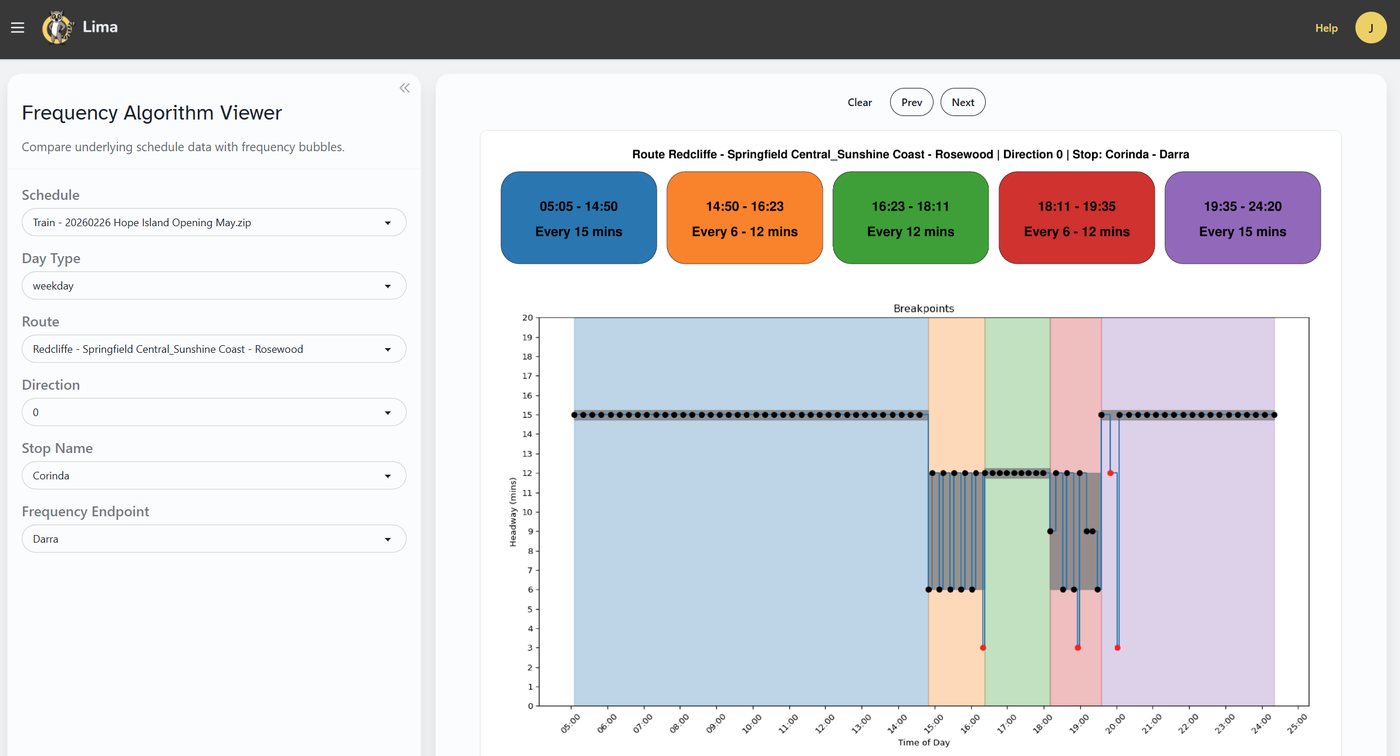
Schedule data chunked into frequency bubbles across the day.
Infrastructure Stream
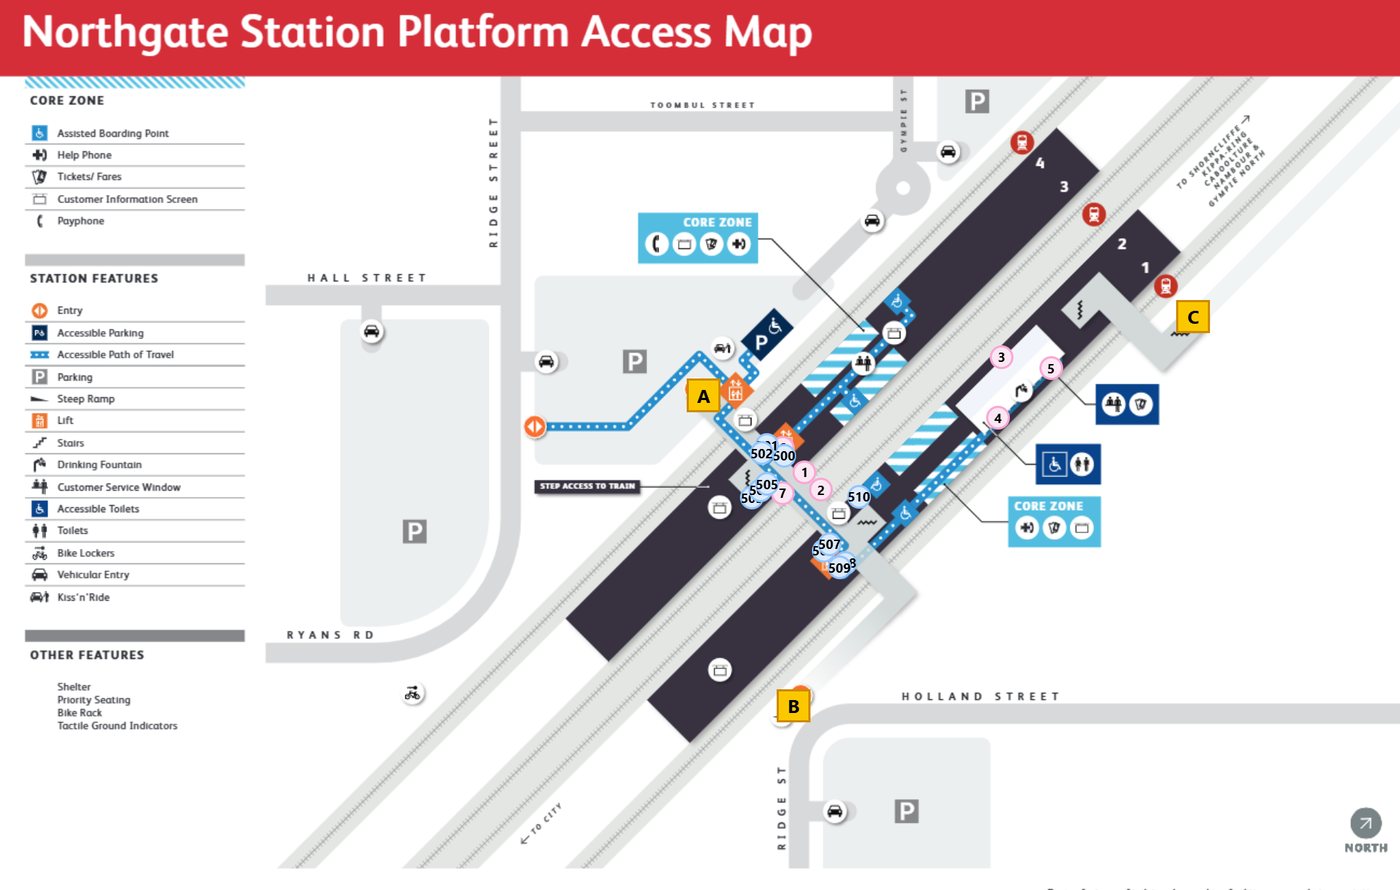
Station and stop infrastructure captured network-wide.
Custom Inputs
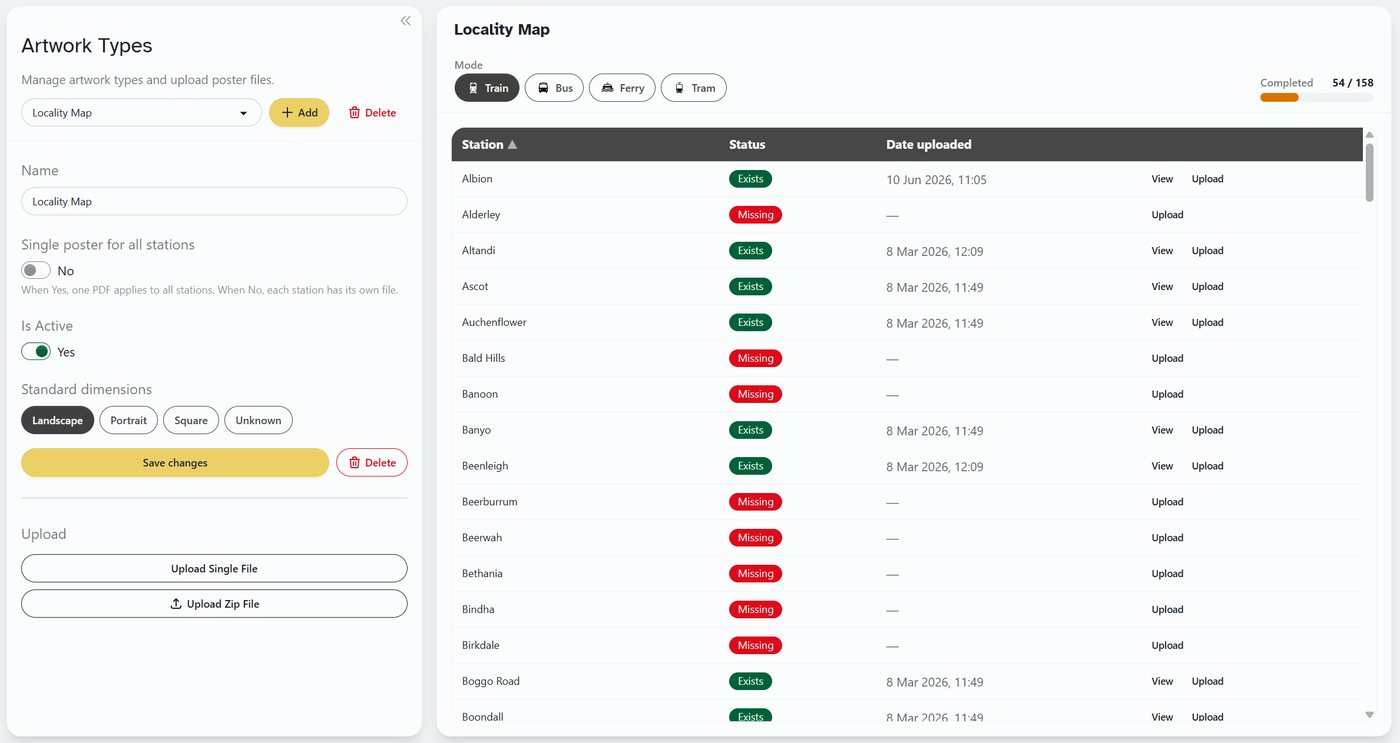
Bespoke artwork and settings integrated seamlessly.
Bespoke Outputs
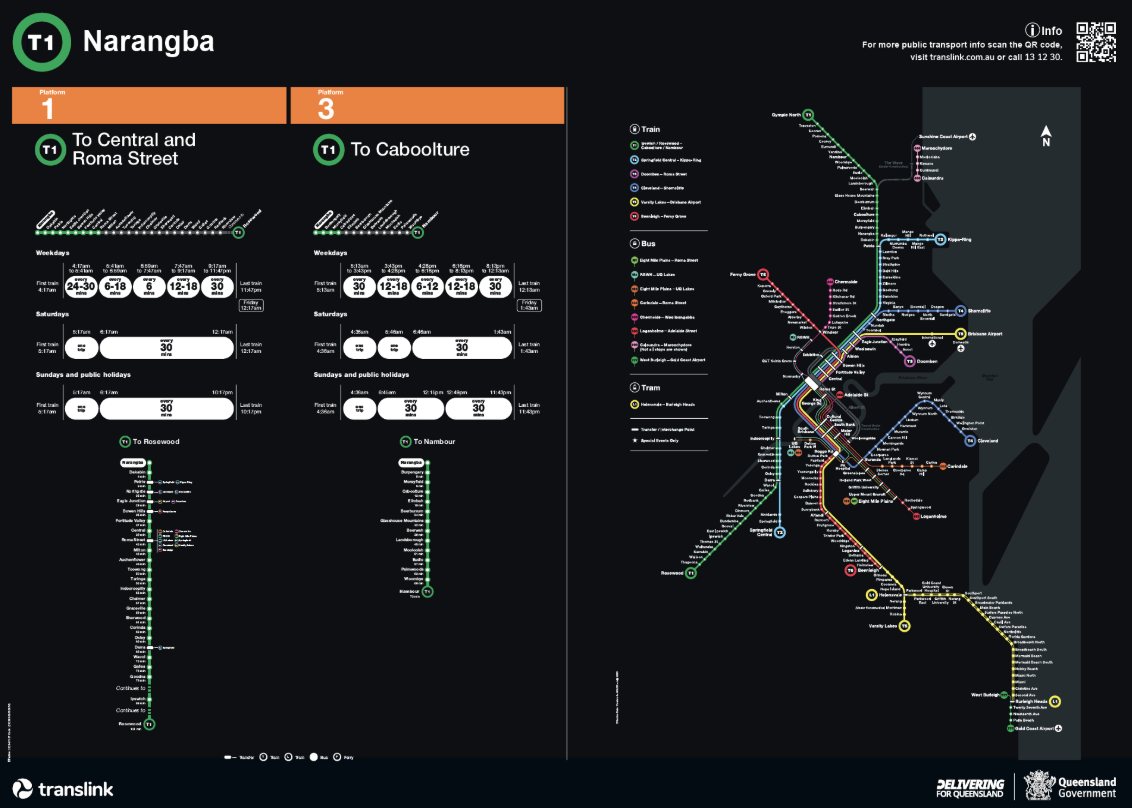
Generated on demand, with full creation history.
Project Description
LIMA is a bespoke platform built for a public transport authority to manage the full lifecycle of customer information — from raw schedule data through to printed, station-ready output.
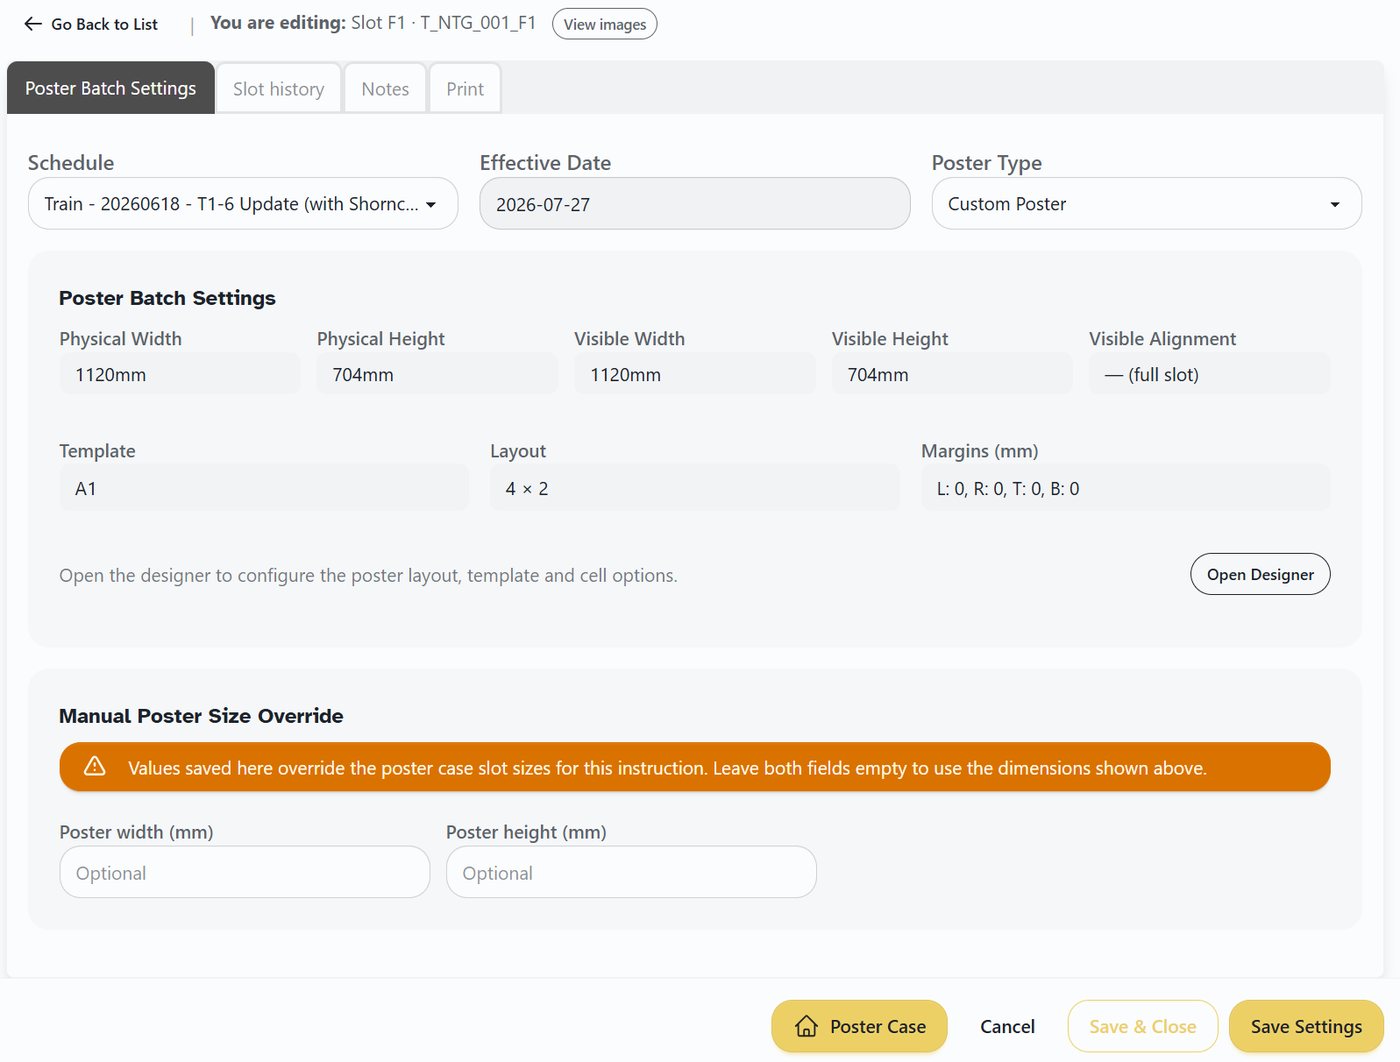
The platform brings schedule data, station infrastructure and bespoke processing into one place — chunking timetables into frequency bubbles, then matching them against digitised, stop-level infrastructure down to individual poster cases.
Outputs are linked to that infrastructure and regenerated on demand as schedules change — printed to the exact size of each slot, with every output tracked through a network-wide completion dashboard.
At A Glance
- Built forA public transport authority
- Core inputsHastus schedule data
- Modes coveredTrain · Bus · Ferry · Tram
- Output turnaroundWeeks → Seconds
- TrackingNetwork-wide completion status
Shots of the Project
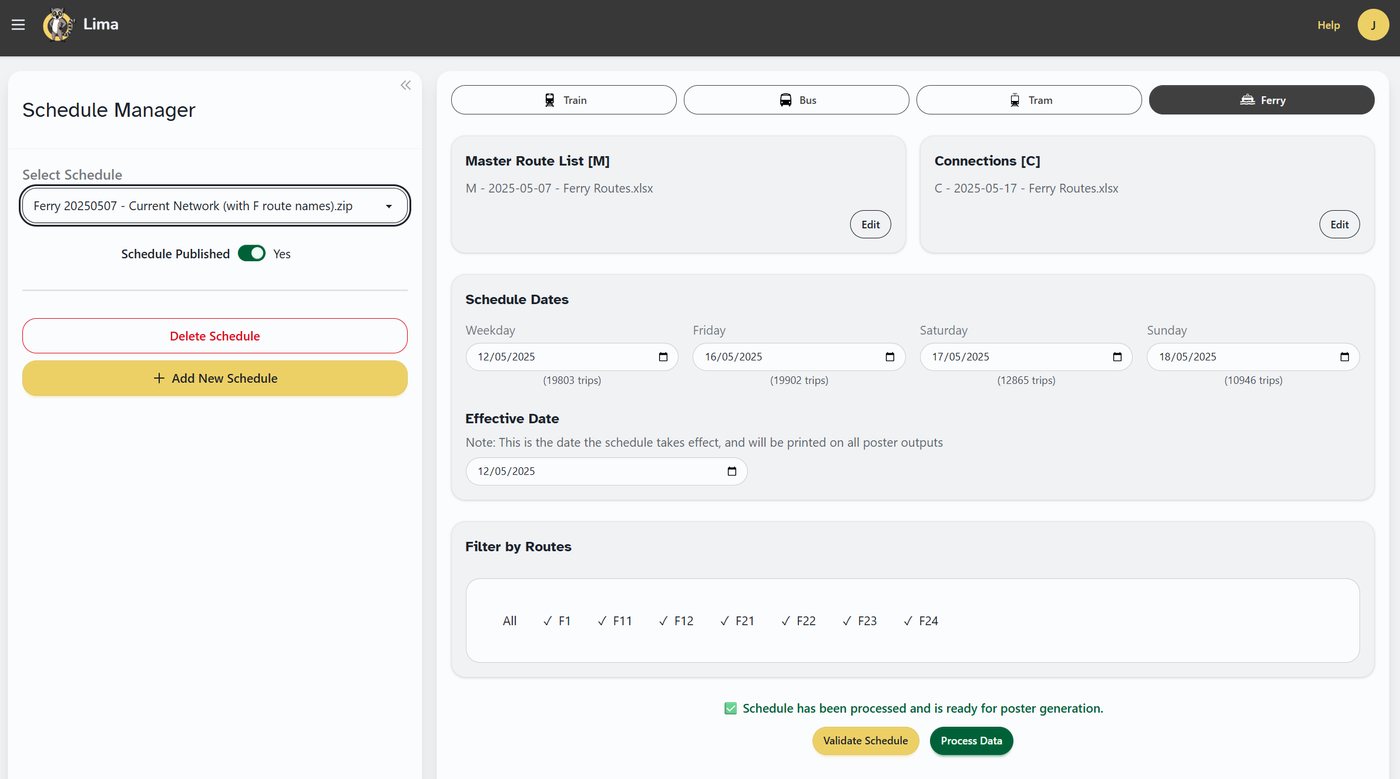
A look inside LIMA — from schedule ingestion and analytics through to the printed, station-ready output.
Want something like this
for your network?
Whether it's schedule automation, station infrastructure tracking, or bespoke customer information outputs — we'd love to hear about your challenge.